Posts

Showing posts from January, 2012

Are "Soft Landings" really softer?

Image
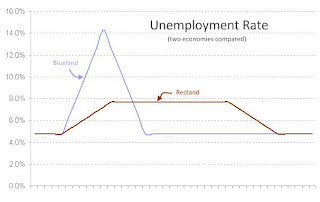
Falling off a roof, I'd rather have a soft landing than a hard one; but, does the metaphor translate to economies? Example: Imagine two countries -- Redland and Blueland -- both with  unemployment around 5%. Next, imagine unemployment shoots up to 14% in " Blueland " while " Redland " has a far milder rise to 8%. However, the rate of unemployment comes back to 5% much sooner in Blueland, while it lingers at a 8% for a while in Redland. Is there any reason to think  Redland is better off in this example? Even if we accept the notion that governments can and may engineer a soft-landing, it is far from clear that a shallower recession is a good thing, if it means extending its duration . Think of individuals: Would you rather be unemployed for 1 year or for 3 years? It's a no-brainer! A laid-off dad from my son's school told me his savings could last him six months before he starts getting desperate. For him, a short sharp downturn would

U.S. - Other unfunded liabilities

Image
Background: This is the third post in a series looking at U.S. government debt. In previous posts I considered the official U.S. Federal debt and the "off balance sheet" liabilities for "entitlements" . In summary, the debt owed to public is about $10 Tr. and the amount owed on entitlements will be about $6 Tr. for the next 12 years (3 presidential terms). Together, this is larger than the annual GDP of the U.S. And there's more: Besides these, the U.S. Federal government has taken on other obligation. For example, Fannie and Freddie guarantee about $5 Tr. worth of mortgages, and even though the government long insisted that it was not liable for these, when push came to shove the government stepped in to support these "government-sponsored entities". With these guarantees, one can know the maximum possible liability, but the actual liability is difficult to estimate. Thankfully, the actual liability will be lower . For instance, Fannie and F

Are Americans spendthrifts?

Image
Low savings rate:  The " personal savings rate " was  10% in the 70's; but, it fell to a low of 2% recently. "Wealth Effect" / Confidence in the future: Take a closer look at the chart. The savings rate rose  a bit in the 1970s, compared to the 1960s. The 70's were an economically-troubled decade. When people feel less certain about their future, and when they feel their wealth has been eroded, they try to save more. This is a rational response. Perhaps this explains the slightly increased savings rates of the 1970s'.  The chart then shows a drop in the savings rate starting in the early-1980s. Could this be because people felt better about their wealth and about their future? This second chart also shows Personal Wealth as a multiple of current GDP. I chose this as a very rough proxy for how wealthy the "average person" feels. In the early 1960's wealth was over 3 times GDP ( see the right-side axis ). By 1975, wealth had dropped

US "Entitlement" programs - Impact on debt

Image
In a previous post , I looked at the U.S. Federal debt. In this one, I look at "unfunded" liabilities for "entitlements". Some people unfunded liabilities for entitlements by assuming an "infinite time horizon" ; such estimates are  over $50 trillion . The trustees themselves use a 75-year horizon, and come up with lower numbers, which are still mind-boggling: around $19 T . This chart from my previous post shows that the U.S. Federal debt is $10 trillion, if one excludes the $4.5 T officially owed to "Trust Funds". So, the  $19 T (the 75 year estimate) is twice what the U.S. government owes on everything else. Trust-funds are an obscuring fiction:  Readers here know that the "entitlement trust funds" are an accounting fiction. About 30% of the costs of entitlement programs are already funded from general funds, not from the payroll tax (roughly 10% is "interest" the government pays on the "trust funds" and abo