Posts

Showing posts from February, 2013

History of the U.S. debt

Image
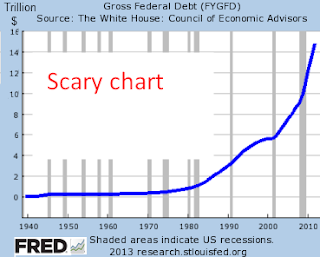
My intent in this post is to question if the U.S. really has a large amount of debt. Some people think we are just years away from a breakdown in the credit of the government. Others think we've gone through bad times in the past and will "grow out of" our problems again. To keep this post simple, all debt figures are "gross". "Gross debt" includes the amounts owed by the government to the Fed and to the Social Security "trust funds". Also, all figures are nominal dollars (i.e. no adjustments have been made for price-increases). [Other, better, measures will have to wait till a future post.] Scary chart: This chart of the "gross" U.S. government debt since   looks scary in the way the amount of debt seems to be shooting up exponentially. Remember the number $16 Trillion dollars. That is the approximate level of gross federal government debt. The total GDP of the U.S., is also about $16 trillion. Has been scary for deca

U.S. Congressional Majorities

Image
The chart below shows the number of seats in the House of Representatives held by the Democratic party and by the GOP, since the early 1900's. For most of this century, the Democratic party has had a majority of seats in the House (out of a total of about 435 seats). The chart starts with a GOP majority, which changes after the stock market crash. During Roosevelt's term the Democrats take a huge lead, and they keep this lead (with two exceptions) all the way to 1994, even through Reagan's presidency. Finally, during Bill Clinton's time -- in 1994 -- the GOP gets the majority back and has held it except for two terms after the recent market crash. [ Source: Numbers come from various articles on the Wikipedia .] I also wanted to understand what would happen if the house had something similar to the filibuster rules of the Senate. About 260 seats is 60% of the total -- see the grey shaded area running across the top. A lot of the time, the ma

Liberals, Moderates and Conservative: Self-reporting

Image
Every year, Gallup conducts a poll where they ask people across the U.S. whether they would call themselves "Liberal", "Moderate" or "Conservative". For the last 5 years, percentages have been fairly stable. Without reading further, can you guess what percentage would call themselves "moderate", and how conservative/liberal would be split? Here is a link to the latest results .  About 37% say they're moderate, about 39% say they're conservative, and about 22% say they're liberal. Since the country's voters divide about 50:50 when it comes to voting for Republicans and for Democrats, it's safe to conclude that moderates lean democrat. If we were to make some rough assumptions and say that voter turnout is equal among the groups and and that "conservatives" vote GOP and "liberals" vote Dem, then a 50:50 vote result would imply that the 37% who call themselves moderate break down into: 10% moderate but le