History of the U.S. debt
My intent in this post is to question if the U.S. really has a large amount of debt. Some people think we are just years away from a breakdown in the credit of the government. Others think we've gone through bad times in the past and will "grow out of" our problems again.
To keep this post simple, all debt figures are "gross". "Gross debt" includes the amounts owed by the government to the Fed and to the Social Security "trust funds". Also, all figures are nominal dollars (i.e. no adjustments have been made for price-increases). [Other, better, measures will have to wait till a future post.]
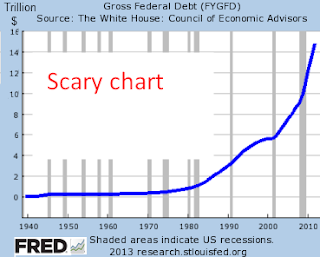
Scary chart: This chart of the "gross" U.S. government debt since looks scary in the way the amount of debt seems to be shooting up exponentially.
Remember the number $16 Trillion dollars. That is the approximate level of gross federal government debt. The total GDP of the U.S., is also about $16 trillion.
 Has been scary for decades: In the chart above, you can see the debt start to rise in the 1970's and quicken in the 1980s. This second chart uses the same data as the first, but stops at 1985. Look at the left-hand scale: the gross debt was just 1.6 Trillion ( a tenth of today).
Yet, the chart, drawn the same height as the first, looks almost as scary. Just because this has appeared scary for decades, we should not be lulled into complacency. Things often worsen over a long time before they become too hard to undo.
Charts with a linear scale on the Y-axis show absolute growth; they obscure growth rates. Going from 1 trillion to 2 trillion shows up as just as big an increase as going from 15 trillion to 16 trillion.
(Also notice, at this scale, the jump in debt to fight WW-II is clearly visible. )
Re-drawing the chart, using a log scale on the Y-axis, allows us to see where the growth rates were steepest.

The rate is fairly steady: Suddenly, the chart looks far less scary. The steepest jump was in WW-II, and subsequent rises have not come anywhere close to that rate of growth.
We see three major periods in this chart: a steep rise in WW-II, followed by 15 years of very slow growth (almost flat by comparison), and, finally, a clear rise in the rate from 1970 to today, with a brief pause during the dot.net boom.
A steady rate is not necessarily good news. If someone is digging themselves into a deep hole, it is little consolation that they increased the depth just as much yesterday, and the day before. In fact, a steady rate means that they were digging a larger amount every day. If nothing changes, there will come a point where they're trapped.
 Debt-to-GDP ratio: A common way to measure the seriousness of government debt is to compare it to GDP. How much is the debt, relative to the total annual production of all the citizens -- who, in their role as taxpayers -- are the underlying debtors shouldering the burden?
We can take two very different messages from this chart.
The scary message: On the one hand: the debt is clearly getting increasingly burdensome since 1980.
The positive message: Or, we can see the glass half-full by noticing that the debt was even more burdensome after WW-II. If the post-WWII generation brought the ratio down to 30% of GDP, then why can't we follow their example and do the same. There may be hope yet: we just have to do what they did!
 Debt and GDP Compared: This chart expands on the Debt/GDP ratio, by showing the two components (Debt and GDP) separately. Notice how GDP grew faster that gross debt until recently.
Also notice, for instance, how the increase in gross-debt slowed slightly in the years before 2000, while GDP kept growing. This explains the dip in the Debt-to-GDP ratio seen on the previous chart during the same years.
Notice that the latest recession has seen a significant shift. Since 2008, debt started to climb much more steeply, until it is now almost equal to GDP.

1950's and 1960's: The scale in the chart above makes it appear that debt and GDP were very close during the 1950s. Scaling up and looking just at those years, we see the true picture.
Now we see the explanation for the rapid fall in the post WW-II Debt-to-GDP ratio. After WW-II, gross debt increased from about $ 275 billion to $400 billion up to 1969. Meanwhile, GDP went from $200 billion to $1000 billion!
The future: If we do nothing about the growth in government debt, and if GDP does not speed up, we face Scenario A in the chart below: the problem gets ever more out of control. If we bring the growth in debt back in line with the growth in GDP, we face scenario B. While better than "A", this is a high-risk scenario that holds the poor status quo. Predictably, a recession will come along, taxes will fall, and stimulus will rise, and we will shift into Scenario A.

Today, in summary: Based on historical norms, the gross-debt of the U.S. is too high, matched only during WW-II. In theory, we should be able to do what the post-WW-II generation did: grow the debt very slowly while growing GDP much faster ("Scenario C" above). Unfortunately, considering today's politics, both those seem improbable propositions. So, in summary, we're justified in worrying.
Update Mar 6th, 2015: GDP is now 17.2 T and Gross debt is 18.1 T. So, it crossed over, like Scenario A and then stayed in parallel like Scenario B. I'd say, we're closest to "B", until good GDP growth moves us to "C" or a slow-down moves us to "A".
To keep this post simple, all debt figures are "gross". "Gross debt" includes the amounts owed by the government to the Fed and to the Social Security "trust funds". Also, all figures are nominal dollars (i.e. no adjustments have been made for price-increases). [Other, better, measures will have to wait till a future post.]

Scary chart: This chart of the "gross" U.S. government debt since looks scary in the way the amount of debt seems to be shooting up exponentially.
Remember the number $16 Trillion dollars. That is the approximate level of gross federal government debt. The total GDP of the U.S., is also about $16 trillion.

Yet, the chart, drawn the same height as the first, looks almost as scary. Just because this has appeared scary for decades, we should not be lulled into complacency. Things often worsen over a long time before they become too hard to undo.
Charts with a linear scale on the Y-axis show absolute growth; they obscure growth rates. Going from 1 trillion to 2 trillion shows up as just as big an increase as going from 15 trillion to 16 trillion.
(Also notice, at this scale, the jump in debt to fight WW-II is clearly visible. )
Re-drawing the chart, using a log scale on the Y-axis, allows us to see where the growth rates were steepest.

The rate is fairly steady: Suddenly, the chart looks far less scary. The steepest jump was in WW-II, and subsequent rises have not come anywhere close to that rate of growth.
We see three major periods in this chart: a steep rise in WW-II, followed by 15 years of very slow growth (almost flat by comparison), and, finally, a clear rise in the rate from 1970 to today, with a brief pause during the dot.net boom.
A steady rate is not necessarily good news. If someone is digging themselves into a deep hole, it is little consolation that they increased the depth just as much yesterday, and the day before. In fact, a steady rate means that they were digging a larger amount every day. If nothing changes, there will come a point where they're trapped.
 Debt-to-GDP ratio: A common way to measure the seriousness of government debt is to compare it to GDP. How much is the debt, relative to the total annual production of all the citizens -- who, in their role as taxpayers -- are the underlying debtors shouldering the burden?
We can take two very different messages from this chart.
The scary message: On the one hand: the debt is clearly getting increasingly burdensome since 1980.
The positive message: Or, we can see the glass half-full by noticing that the debt was even more burdensome after WW-II. If the post-WWII generation brought the ratio down to 30% of GDP, then why can't we follow their example and do the same. There may be hope yet: we just have to do what they did!

Also notice, for instance, how the increase in gross-debt slowed slightly in the years before 2000, while GDP kept growing. This explains the dip in the Debt-to-GDP ratio seen on the previous chart during the same years.
Notice that the latest recession has seen a significant shift. Since 2008, debt started to climb much more steeply, until it is now almost equal to GDP.

1950's and 1960's: The scale in the chart above makes it appear that debt and GDP were very close during the 1950s. Scaling up and looking just at those years, we see the true picture.
Now we see the explanation for the rapid fall in the post WW-II Debt-to-GDP ratio. After WW-II, gross debt increased from about $ 275 billion to $400 billion up to 1969. Meanwhile, GDP went from $200 billion to $1000 billion!
The future: If we do nothing about the growth in government debt, and if GDP does not speed up, we face Scenario A in the chart below: the problem gets ever more out of control. If we bring the growth in debt back in line with the growth in GDP, we face scenario B. While better than "A", this is a high-risk scenario that holds the poor status quo. Predictably, a recession will come along, taxes will fall, and stimulus will rise, and we will shift into Scenario A.

Today, in summary: Based on historical norms, the gross-debt of the U.S. is too high, matched only during WW-II. In theory, we should be able to do what the post-WW-II generation did: grow the debt very slowly while growing GDP much faster ("Scenario C" above). Unfortunately, considering today's politics, both those seem improbable propositions. So, in summary, we're justified in worrying.
Update Mar 6th, 2015: GDP is now 17.2 T and Gross debt is 18.1 T. So, it crossed over, like Scenario A and then stayed in parallel like Scenario B. I'd say, we're closest to "B", until good GDP growth moves us to "C" or a slow-down moves us to "A".
‘Charts with a linear scale on the Y-axis show absolute growth; they obscure growth rates.’
ReplyDeleteIn fact, the slope of the first two graphs indicates the growth rate. The problem between these figures is that they have different y-axes which should be taken into consideration when you interpret them. The third graph does not show the rate of growth directly; actually it shows the natural log of the absolute debt and so if you interpret it correctly it does indicate a steady increase in the rate of growth.