How're we doing on Home Prices (July 2013)?
The first two measures compare prices to rents and to median income. Doing so, factors out the "nominal" aspect of price-change.
Price-to-Rent ratio: Over a year ago this measure was almost down to the 1990 average. Since then, it has almost flattened out, falling only slightly.
Source: As always the best source for such charts is the Calculated Risk blog.

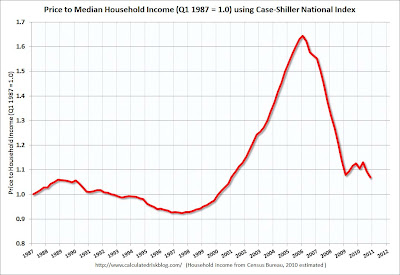
Price-to-Income ratio: A very similar pattern here. (Caveat: Chart only up to 2011)
By both these measures, we can see that prices are slightly above their historical average, but only slightly (and way below their boom-time prices). They also seem to be flattening out.
Seems a decent enough time to buy a home.
Debt Obligation Ratio: Instead of price, this measure looks at the monthly payments. Since interest rates are low (they've risen in the last month though), by this measure people are spending a historically low percentage of their incomes on mortgages. Other consumer debt is not high either, by historical comparison.
Again, a decent time to buy. In fact, if one considers interest rates to have bottomed, it's a good time to buy.
Home ownership rate: This is the one measure of these four that is not so great. Though it is off its peak, it is not down to historical levels.
In other words, there is no huge "pent up demand" for homes.
Summary: Home prices could drop a bit it more while bottoming out. However, it seems a reasonable time to buy, base on "U.S. averages", if one plans to keep the house for many years. Buffett and Schiller have been saying so for about a year, and they're pretty savvy on this topic. The numbers above support them.
Caveat and Disclaimer: It's said that "all real estate is local". All the graphs above are national averages; local situations can vary quite widely.


Comments
Post a Comment