Posts

Showing posts with the label US ECONOMY

Labor Participation

Image
Feb 2014 report:  "Good news" - U.S. total employment is only a few months away from reaching its peak (2007-08). The total number of people employed fell off by about 6 million people, and has now risen over 5 million from the bottom. The "bad news" is: the working-age population grew by about 12 million in the meanwhile; and employment is only just getting back to the pre-12 million level. Participation rate:  Oddly, of those 12 million, 10 million say they aren't looking for work! The "participation rate" has plunged. Today, anyone listening to business news knows that is one reason the unemployment rate has improved; i.e. fewer people have been looking for jobs. Not Early Retirement: The other day, a talking head on TV said that people are taking early retirement. Sounds plausible, but it shows ignorance. Here are two charts for U.S. men aged 55-64 The mid 1990s, saw a reversal of a long-term down-trend. Instead, more men in this age grou...

How much Social Security will you receive?

Image
Will social security be there for you? It is almost cliche to say "it will be gone by the time I retire".  Yet, almost everyone is relying on it. Are you relying on social-security to be there for you? If you're preparing for the worst, good for you; but, what's the most likely way in which this will unfold? How are "benefits" calculated?   This a very rough calculation:  First, estimate your average annual salary over your lifetime (up to the max. of about $100K, after which payroll taxes are not deducted).  You are promised $90 for each $100 of average earning, but only for the first $9000. Then, for the next "slab" you are promised 30%. Finally, for anything over $55K, it is 15%. ( Benefits are indexed to CPI. These numbers assume 2010-equivalent dollars.) Sample calculation: Suppose you just retired, having started working in the late 1960s. Your peak earning years were probably around 1990. Let's say you earned an average ...

History of the U.S. debt

Image
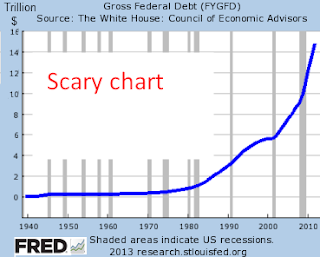
My intent in this post is to question if the U.S. really has a large amount of debt. Some people think we are just years away from a breakdown in the credit of the government. Others think we've gone through bad times in the past and will "grow out of" our problems again. To keep this post simple, all debt figures are "gross". "Gross debt" includes the amounts owed by the government to the Fed and to the Social Security "trust funds". Also, all figures are nominal dollars (i.e. no adjustments have been made for price-increases). [Other, better, measures will have to wait till a future post.] Scary chart: This chart of the "gross" U.S. government debt since   looks scary in the way the amount of debt seems to be shooting up exponentially. Remember the number $16 Trillion dollars. That is the approximate level of gross federal government debt. The total GDP of the U.S., is also about $16 trillion. Has been scary for deca...

What is the "Milk Cliff" ?

Image
In the middle of the "fiscal cliff" stand-off, there are stories about a  "milk cliff" . If Congress does not act, milk prices might rise substantially -- potentially doubling. Price support programs  have been around for decades. Herbert Hoover desperately tried to keep prices from falling, and was fairly successful at doing so (prolonging the great depression). The intellectual root comes from monetarist economists who want the government to ensure the stability of prices, in order to fight deflation. [Today, some of these are cheering Japan's new Prime Minister Abe who says he wants prices to rise at least by 2% per year.] Roosevelt doubled down on the madness. In 1933,  millions of pigs were slaughtered . They were not handed out to the hungry poor struggling to get by. Instead, they were buried in mass graves. Posterity will not believe this. The Dairy Product Price Support Program makes the government buy milk. The current program dates from 1949. ...

Raise everyone's taxes

Image
In this 2-minute video, CNBC's, Maria Caruso Cabrera demonstrates the abysmal quality of mainstream business reporting: First, Cabrera implies that Democrats are wrong in a wanting to raise tax-rates on the rich. Then, with no sense of irony, she suggests means testing for Medicare. She ought to know that means testing is as much a progressive tax as the Dems push to raise the marginal rates. The GOP want to tax the rich just as the Dems do...they just want to pretend they don't. Payroll tax are taxes:  Today's social-security system is very progressive. Richer folk are paid out more than the poor; but,  proportionally the rich are paid out far less. We have  Alan Greenspan to thank for this . Medicare is even worse. The rich pay in far more and get nothing extra -- not even a better walking-stick -- in return. The  Simpson-Bowles  plan would shore up social security. In part, it would do so by raising payroll taxes on the rich, but only pay...

U.S. Economy: Federal Debt- How big is it?

Image
( Updated: Dec 2012 ) Lots of numbers:  Trying to get a clear picture of U.S. government debt can be frustrating. The government owes: 60% of GDP : bonds owed to private entities , both foreign and domestic 100% of GDP : if we add bonds owed to the government-itself (e.g. Social Security "trust fund", Federal Reserve) 400%+ : if all Fed promises to social security and medicare recipients are met (they won't be) [Note: the GAO claims that adding another 2% (of payroll) to the current 13% payroll tax would keep social security funded for more than 70 years!] A snapshot: The U.S. government (officially) owes about US $16 trillion to the public, plus to the Fed, plus to the "trust funds".  The GDP of the U.S. is approximately $16 trillion. (Both these were about $15 Tr. last year.) To put this in perspective:  adding up the assets of everyone in the U.S. and subtracting liabilities, we get a "net worth" that adds up to about $ 64 trillion ($5...

The Fiscal Cliff

Image
" The fiscal cliff ", is a poor name, that obscures through metaphor. Call it what it is:  a little deficit reduction . All the cries to "not go over the cliff" are cries to not reduce the deficit. CNBC, usually middle-of-road is running a campaign called "Rise Above", asking law-makers not to reduce the deficit (i.e. not to go over the cliff)! Taxes will rise if:  the "Bush tax cuts" and "AMT exception" expire,  the Payroll tax goes back, up to its normal rate Some government spending will falls if: unemployment benefits go back down to their normal rate "sequestration" agreed to when extending the debt-ceiling kicks in Too much too soon: Keynesians never want to reduce deficits, but they couch their appeal saying: "don't cut right now ", "don't cut too much " or "don't cut too abruptly ". Yes, tightening will cause some short-term pain, but it'll be worse later. ...

Don't expect QE3 to send prices shooting up

QE3: The Fed just announced a larger-than-expected, and open-ended "QE3". Do not expect significantly higher price-rises in the medium term (at least the next few years). Definitely do not expect hyper-inflation.  Most people who predict hyperinflation use some variant of the "Linear Quantity Theory of Money" and the concept of a banking "Multiplier". Both these ideas are false (except in a fuzzy, informal way).  [ Ludwig von Mises criticized the Linear Quantity Theory of Money , but many Austrian-sympathizers still continue to apply it.] The typical interpretation of the Quantity Theory of Money takes the view that there are two important aggregates: on the one hand, there is money; and, on the other hand there are goods traded... with other factors staying mostly constant over the short-run. This model leads people to think: more money is being created, so prices of goods will go up. Money vs. Goods: There are issues with both sides of the Quan...

End city government pensions

Cities in trouble: Many U.S. cities are hard hit because they promised retirement-benefits they could not deliver. With property taxes down, cities are being squeezed. Camden, NJ wants to shut its entire police force and outsource to the County. Miami declared a state of "financial urgency" for the fourth year. In Stockton, CA, a police chief who lasted for 8 months is drawing a pension of over $200,000 a year ; the city recently filed for bankruptcy protection. While tax-payers were not paying attention, mayors made some exorbitant promises to public unions.We're now in a phase where it is clear that many local governments cannot keep these promises. Bankruptcy can be good: Bankruptcy is a legal way to recognize an untenable situation. It allows people to recognize some losses, and then allows both debtor and creditor to move on. Before bankruptcy, a debtor often tries in vain to meet commitments he cannot meet, instead spiraling into a worse hole. Citie...

Where did all the stimulus go... (When will they ever learn?)

Image
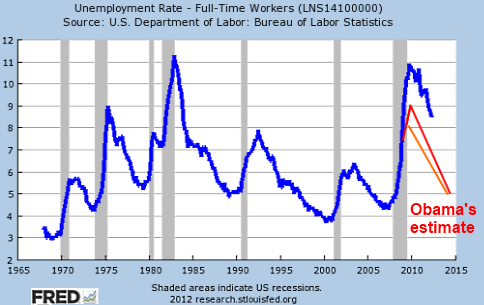
In Jan 2009, proposing almost $1 trillion in new spending, President-elect Obama said : " ...at this particular moment, only government can provide the short-term boost necessary to lift us from a recession this deep and severe. Only government can break the vicious cycles that are crippling our economy... " Obama's team released expectations of the unemployment rate with and without the stimulus. Their  prediction for the unemployment rate at the end of Obama's term with and without the stimulus , was -- drum roll -- 5.2% as against 5.5%! They also predicted that by 2014, we'll be about the same with or without the stimulus. Here are the options they offered us, using their figures and assumptions, not mine: without stimulus, ( red line ) unemployment will rise to 9% and go down slowly to 5% by 2014 with stimulus ( orange line ), unemployment will rise to 8% and go down much faster reaching 5% by 2014 Here is a graph of unemployment rates. Notice the...

Is the "individual mandate" really that bad?

The "individual mandate" (buy health-coverage or pay a fine) is the political focus for the week. I hope the SCOTUS decides the "mandate" is unconstitutional and also rejects all of Obamacare. The problem with health-care: The problem with the U.S. healthcare system is that it is already heavily statist. Medicare and Medicaid control a big part of healthcare spending. Just as important, the government has imposed huge costs on private insurance via mandates, making it impossible for the poor to afford legal health-care. Existing mandates:  While the SCOTUS was debating the "individual mandate", the GOP in Michigan  was mandating that anyone who buys private insurance must also buy coverage for autism. To someone with private health-insurance a mandate that says "y ou must also buy cover for disease XYZ, whether you want to or not ", costs money. Compared to this, a mandate that says " you must buy health insurance " has no immedi...

Federal Debt projections

Image
Background:  This is the fourth post in a series looking at U.S. government debt. In previous posts I considered  the official U.S. Federal debt  ( $10 Tr. ), the liabilities for "entitlements"  ( $6 Tr. over the next 12 years) and other liabilities  ( $4.5 Tr ). The official debt is over 60% of GDP. Adding entitlements, we're at 100% of GDP. Adding it all, we are nearer 150% of GDP. These levels are high, but the bigger issue is that there is no plan to change this trend.  Neither major political party has any plans to reduce the debt in the next decade. Under current plans, we will add another  $9 Tr.  in debt. over the next 12 years.  The U.S. is planning to go bankrupt, some time in the future. Crying wolf?  But, haven't we heard all this before? In the 1970s, people were already warning about U.S. debt levels, and in the 1980's and 1990s. So, isn't the fear of bankruptcy just "crying wolf"? H...

A modest Platform - On Employment Policy

To solve the problem of unemployment in the U.S., the government must end statist intervention. Lot's can be done (more accurately, undone). Here are some modest proposals -- not completely free-market ideas for the Federal government, but transitional steps. Abolish the Federal minimum wage rate of $7.25 per hour. With exquisitely bad timing, Congress increased this at the peak of the housing bubble in 2007, from the previous minimum of $5.15 per hour . At some level the rate becomes academic; so, lowering it enough would be almost as good as abolishing it. Here's an even more modest proposal: every 6 months, this minimum wage will be reduced by another 50 cents if the youth (16-19 years) unemployment rate has not fallen by at least 1% during the previous 6 months. An, even more modest: a multi-year moratorium from the minimum wage. Many states have minimum-wages higher than the federal rate. Lowering the Federal rate will increase the wage-differential between such sta...

U.S. - Other unfunded liabilities

Image
Background: This is the third post in a series looking at U.S. government debt. In previous posts I considered the official U.S. Federal debt and the "off balance sheet" liabilities for "entitlements" . In summary, the debt owed to public is about $10 Tr. and the amount owed on entitlements will be about $6 Tr. for the next 12 years (3 presidential terms). Together, this is larger than the annual GDP of the U.S. And there's more: Besides these, the U.S. Federal government has taken on other obligation. For example, Fannie and Freddie guarantee about $5 Tr. worth of mortgages, and even though the government long insisted that it was not liable for these, when push came to shove the government stepped in to support these "government-sponsored entities". With these guarantees, one can know the maximum possible liability, but the actual liability is difficult to estimate. Thankfully, the actual liability will be lower . For instance, Fannie and F...

Are Americans spendthrifts?

Image
Low savings rate:  The " personal savings rate " was  10% in the 70's; but, it fell to a low of 2% recently. "Wealth Effect" / Confidence in the future: Take a closer look at the chart. The savings rate rose  a bit in the 1970s, compared to the 1960s. The 70's were an economically-troubled decade. When people feel less certain about their future, and when they feel their wealth has been eroded, they try to save more. This is a rational response. Perhaps this explains the slightly increased savings rates of the 1970s'.  The chart then shows a drop in the savings rate starting in the early-1980s. Could this be because people felt better about their wealth and about their future? This second chart also shows Personal Wealth as a multiple of current GDP. I chose this as a very rough proxy for how wealthy the "average person" feels. In the early 1960's wealth was over 3 times GDP ( see the right-side axis ). By 1975, wealth had dropped ...